c8400.com
consumption, taiwan
concept essay
I came to Taipei in the summer of 2014: June, July and August. Each month, I recorded all of my expenses and kept the receipts. After the month was over I summed up the expenses, grouped by the business where the purchase was made. I selected the businesses where I spent the largest sum of money, returned to these businesses and took a photograph of the façade with the company store front. Thus the decision what to photograph has been derived from the prior decision what to buy.In the presentation of the work, photographs of invoices are displayed next to photographs of the buildings which house the companies where the purchase documented on the invoice has been made. The work exists in the form of a three-volume photobook. Each volume documents one month’s consumption – June, July and August respectively. A limited print edition of three-volume photobook is available in 20 artist signed copies.
The following text provides background to how the project was conceived and explains the driving forces behind decisions shaping its appearance. The text is structured into three parts, each focusing on one factor which significantly shaped the thought directions that fuelled this project: Consumer decision processes (“Decisions”), traces and records left behind by decisions and the surrounding information ecology (“Records”) and lastly the process of reading and interpretation of information in an urban context (“Reading”).
Decisions
Every second we make decisions. Moving in one direction means that we gave up moving in the other direction. If we decide to meet friend A, we have no time to meet friend B. If we decide to eat sushi for lunch, we gave up eating a hamburger or something else. It is not possible to not decide.
Decision making processes are at the core of what economists study: Decisions are extrapolated into indifference curves, exchange ratios between choices calculated and elasticity of aggregated demand curves measured. Economic theories are however not ‘only’ theories. They shape behaviors and decisions of those who believe in them, and as a result, they shape the design of our environment, including the design of choices available. Restaurants carefully observe the popularity of meals on their menu and adjust the offer according to observed demand. Supermarkets even more carefully craft the design of shelving and arrangement of products, an activity which has been elevated to the status of a science. As a result, when we enter a supermarket, we are there to prove that the theory is right. Among the carefully crafted choices made available to us, will we choose according to the theory’s prediction?
There are some decisions which are more straightforward to make, e.g. those connected directly to our livelihoods. We need to find a place to sleep, we need to eat something. We have an ‘unlimited choice’ between limited choices made available to us given social, geographic, financial and time constraints. In the end, utility counts most in these decisions, thus, usually without thinking, we grab a burger for lunch and throw some milk and cereals into our shopping basket for breakfast tomorrow.
Other decisions appear to be less constrained, and the ‘freedom’ of making decisions is even actively marketed as part of their value. We go on holidays to take a rest from all the worries (decision making) in our daily lives. We go to another country, ‘anywhere we like’, where we can, for a limited time, do ‘whatever we want’ and enjoy ‘freedom’. Yet even before leaving the airport, we stuff our pockets with tourist guides and advertisement-cluttered city maps, and our smartphones with a digital versions thereof. Now, on our holiday we are ‘free’ – eating at guidebook recommended restaurants, visiting ‘must see’ tourist attractions and taking photos that have been taken a million times before, just to prove that we are still alive.
Artistic creation is considered as the most ‘free’ of all. The notion of ‘artistic freedom’ is the motivation for many to enter the field of artistic creation. However, in the end, even artists are not beyond the reach of indifference curves and budget constraints. Artists often depend on the art market and are influenced by art market trends, and this relationship has been discussed many times. However even the seemingly ‘free’ decisions made when selecting a subject, one specific section of the field of view, one point of view and not another one. Even this decision making process has been discussed numerous times and John Berger offered probably the most brief yet telling description of some of the underlying processes. It seems that even in the artist’s mind, even before the idea reaches its material form influenced by economic constraints, it is already caught in web of forces (“the social”) that are the results of prior economic relations anyway.
In “Consumption” I took the activity of exploring the city of Taipei and ‘short-circuited’ the decision making process across the different levels of ‘freedom’ in decision making. The primary aim is to make the invisible visible, by combining two ranges of decisions about two different groups of needs. On one hand, it is the range of livelihood decisions reflecting our physiological and safety needs (what we buy/consume), on the other hand it is the range of our experiential decisions reflecting our needs for esteem, love and belonging (what we do/see/hear/..). A third decision range, which is not directly shot-circuited but hovers over the work as a possibility (to some extent shaped by this very essay) is our intellectual activity reflecting self-actualization needs (what we think/dream/believe).
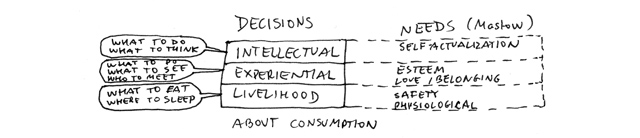
Fig. 1
One of the ‘games’ proposed by early urban explorers (keywords: Situationism, psychogeography, Guy Debord, Raoul Vaneigem) was to walk around a city using a map that depicts a different city (e.g. walking around London using the map of Paris). In my work, I substitute the Situationist ‘map’, for ‘consumption map’. The juxtaposition which I undertake is not one of imposing a map of a geographical location onto the streets of another, but one of imposing a record of daily consumer decisions onto the streets of Taipei, which should under ‘normal’ circumstances be navigated according to experiential (tourist/artist) decisions: What to see, what to photograph. In other words, I do not allow each of these layers to exist separately: Livelihood consumption and experiential (visual) consumption do not exist side by side, but they enter into a causal relationship.
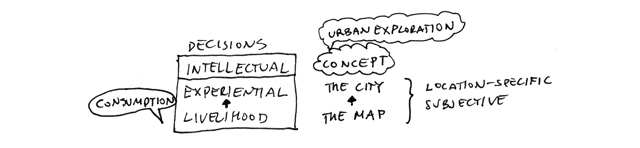
Fig. 2
As a result, similarly as urban explorers walk around the streets guided by a strange map in order to break their existing habits, I walk around the streets guided by a set of data extracted from invoices documenting my consumption. In contrast to the above-mentioned Situationist proposal, the routes are not as random, as there is an “I” which serves as the connecting link between the guiding layer and street level reality. It is not a severance of relations, but the aforementioned short-circuit: The element left out from the circuit is the decision making process of ‘what to see’ and ‘what to photograph’ which would be part of tourist activity as well as of artistic practice. As a result, the decision what to see and what to photograph is a direct result of the prior decision what to buy. In a narrow sense of the artwork, the photos do not represent what I would like to see or show, but they represent what I consumed.
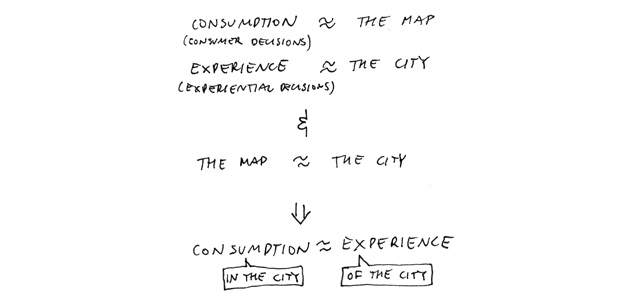
Fig. 3
Records
Every second, time passes. There is no way we can stop the universe from changing. When we think of it as a whole, it is a nauseating amount of infinite interconnected processes. As we cannot stop thinking either, the only way to keep going without turning mad is to try to establish a sense of order and causality. Of course some post-modern philosophers claim that there is no order, and no grand structure to hold on to, but still, even their books start with an introduction and end with a conclusion. Our civilization is based on this quest of ordering, trying to make sense of what is happening to us.
Keeping records is a critical part of trying to understand the passing of time and theorizing about life: From ‘scientific’ measurements of environmental variables (themselves only possible due to prior codifications of measurements that established the scales for measuring), to social statistics where the existence of a human is reduced to a one (exists) or zero (does not exist), to very private records which we keep only for ourselves, never meant to be shared with others. Even smaller than that are traces, which we are leaving behind by our very existence, without intention.
Our individualities are often reduced to a number or code. For the institutions and corporations we are interacting with every day, we are nothing more than a set of data, often simplified into a simple ‘traffic light’ symbol on the screen of the customer service representative, indicating our credit rating, access authorization or purchase history. On top of that, these records documenting our lives are often stored in places we have no access to: Someone else knows more about us then we do.
We can also keep our own records. We can sense victory over time when we read an diary we wrote a few years back, an empowerment resulting from overcoming the limits of our own memory. A diary is only the most obvious example of a record. Smaller in scale than a diary, we can look back to read traces we left behind. There are intentional traces, like photographs, now scattered all around the suite of digital devices we own, but also less obvious traces resulting from our daily activities and consumer decisions, where we need to look twice to realize they exist: All the pens and pencils stored in the holder on your desk. All the shirts and skirts in your wardrobe. The contents of the trash can in your kitchen. Every of those items passed through your hands and memories have been attached to it. All these are records of our lives, waiting to be read and interpreted.

Fig. 4
The traces left behind by our consumer decisions are prominent part of what we leave behind, but before they are taken from us and aggregated as a decision tool for future product arrangements on supermarket shelves or interface adjustments on the e-shop homepage, is there any way we can make use of them in order to make sense of our own lives, on our own, before we will be offered a selection of ‘products’ that are merely a repackaged version of our own excrements? Maybe, in a similar way as we use a diary to reflect on our daily experience, we could use the traces of our own consumption to reflect on our consumer decisions. In the end, marketing researchers do this all the time.

Fig. 5
Data aggregation is not just employed to study the “social” and to sell stuff to us, but is also used to govern and control the population of a country. Consumption “C” is one of the four variables in the C + I + G + NX equation to calculate Y, the gross domestic product (GDP). The aggregate value of each and every consumer decision is fed back to us in the form of one number, usually cited as a percentage value of GDP growth. The mediation of this number, combined with expert’s forecasts and politician’s promises, justifies the approval of new laws and allocation of government spending, and unarguably also shapes the next round of our consumer decisions.

Fig. 6
In “Consumption” I used my own consumption traces, employed simple statistics to aggregate the traces and combined them with consciously produced photographic records. The result is a hybrid constructed according to personal consumer decision data. In a similar way I previously referred to short-circuiting the decision making process, I can now refer to a short-circuiting the consumer decision data flow: Instead of having consumer decision data flow into the corporate databases, where they are analyzed by marketing specialists and fed back in the form of new purchase offers, and instead of having them aggregated by the statistical office and fed back in the form of a GDP growth indicator, I feed my personal consumer decision data directly back into my own decision making process. The decision where to go/what to photograph is directly derived from the prior consumer decision, without having to go through the greater cycle of the corporate and national data aggregation economy. Interestingly, even the decision to produce the artwork itself (i.e. to consume services of a printing company), appears in the latter issues of the “Consumption” artwork, which completes the direct feedback loop of individual consumer decisions up on itself.
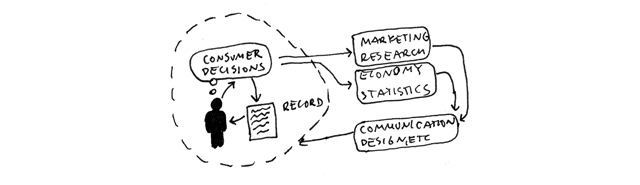
Fig. 7
In this way, “Consumption” becomes not only a record of the prior consumer decision juxtaposed with the urban space of Taipei, but it also becomes a record of its own production process (which is part of my personal economy). While I did not free myself from existing data flows, I managed to establish an additional data flow and feedback loop which can be utilized as a tool for further decision making.
In addition to that, “Consumption” stays what it always was – a record of a specific three-month period spent in Taipei, documenting my very personal consumption patterns. It is a personal consumer profile, like one of millions bought and sold by corporations in the form of marketing research data, loyalty card records and website clicks. It is also a raw record of one small “c” which will become aggregated into the big “C” which will then become one part of the overall “Y” (i.e. GDP).
Reading
Every second, we not only live and make decisions, we also, as long as our eyes are open, look and interpret (‘read’) what we see. We not only read text, we also read our environment, we read other people’s faces and body language, we read the space and landscape features, and we read interiors and exteriors of buildings. We compare each stimulus we perceive to what we already know, we try to find a pattern and fit it into the existing knowledge of the world. What we “read” in our environment are all records and traces left behind by someone or something.
We can identify different processes of perceiving and understanding our environment. The very initial layer is a pre-conscious, instinctive understanding of the environment, e.g. sensing danger when a not yet identified object quickly approaches us, or turning our head we hear a not yet identified sound. We feel the size and weight of the building before we understand what we see in detail. In this process our percepts are matched using our instincts with pre-language experiences of danger, mass and volume, similar to the way a baby sees the world. The process following the pre-knowing language before language identifies visual patterns. We know what we see and assign the object to a category of previously seen objects. Now we know. This in turn enables us to operate with what we see and conceptualize the relationships between the occurrences in our field of view, which is the third process of perceiving and understanding. Now we understand.
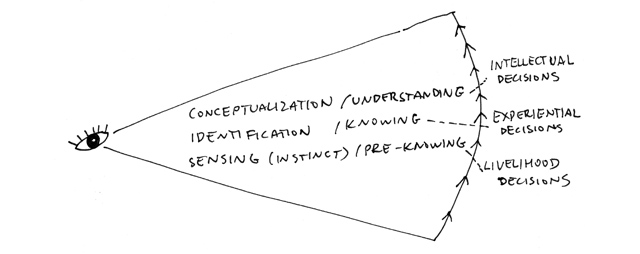
Fig. 8
Reading the city is but a specific instance of these processes of perceiving and understanding. We identify shapes, structures, volumes. We read company names and products of building façades. While the city is three-dimensional, the surfaces – the façades of buildings - we are looking at are mostly flat, not dissimilar to a sheet of paper, inscribed with messages.
In “Consumption”, the façade of a building is compared to the surface of an invoice. Both the invoice and the building façade usually feature the name of the company, sometimes also a logo and a visual or textual description of the products and services offered. In Taipei, the façades of buildings are often nothing more than a blank surface covered up with posters, advertisements, and illuminated signs. The similarity with a poster or invoice surface is more than a similarity – they are moving closer and closer together.
Juxtaposing the invoice and the photograph of the building is on one hand done to point towards this visual similarity. On the other hand, showing an invoice from a previous purchase (i.e. consumer decision) next to the building where the purchase was made also makes the invoice serve the purpose of providing a narrative to the photograph of a building, as they are in a causal relationship. While the invoice is the record of the actual consumer decision, the photograph is the record of another visit, directly related to the previous decision yet at a later time. The story told by the invoice (date, location, goods purchased) provides an entry point to the photograph next to it.
To invoke the previously mentioned notion of a short-circuit for the third time, we can talk about the intermingling of the aforementioned processes of perceiving and understanding, ranging from pure instinct to visual recognition to conceptual thought. While the original consumer decisions have been made almost instinctively, they are now linked to the resulting photograph using a conceptual shortcut that prevents the full decision making process of selecting a location, a motive and pressing the shutter. The task of using one’s senses to identify an aesthetically interesting object has been assigned to the statistics of a personal economy. The senses however re-emerge in the completion of the work. Taking the photograph itself involved aesthetic decisions. The visual similarity between façade and invoice has influenced the photographic method emphasizing the flatness of the façade. Therefore from the point of view of the process of reading, the metaphor of the short circuit seems incomplete. Rather that short-circuiting the process of reading, one could speak of a re-composition, where layers are rearranged yet not left out.
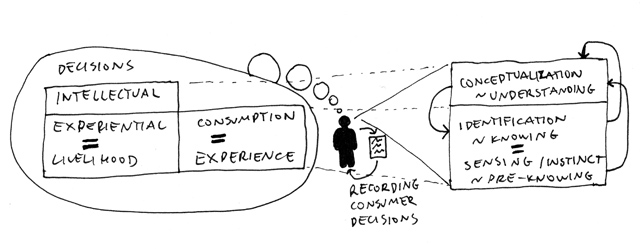
Fig. 9
The reading of the invoices as well as the reading of the building façades each provides a fragment of information that come together as a consumption pattern, represented in a visual form. The rearrangement of the reading process allows for a different way of connecting a decision making process to a process of urban exploration. I did not plot the locations of consumption onto a traditional map, as one of the aims of the project is to replace the map representing geographic measurements with the consumption record, which may be influenced by spatial dispositions, but not shaped by them. In this work, the ‘map’ is the array of consumer decisions. Individual entries within this map serve as windows onto specific sites in the city of Taipei where the purchases were made. The sites would not be the objects of observation were it not for the specific pointer used to look at them. We are reading sites of Taipei, using pointers calculated from invoices, records of prior consumer decisions.
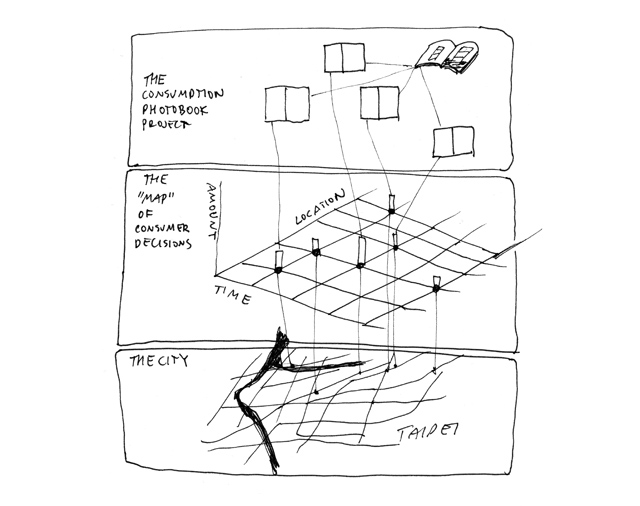
Fig. 10
Summary
While the preface simply described the process of creating the work - taking photographs of Taipei architecture according to a map based on previous consumer decisions – the following sections focused on three points of view from which the “Consumption” project has emerged.
The first point of view is the process of decision making. We make decisions all the time, including decisions about what to purchase. While some decisions are more instinctive and limited in choices, related to our basic needs, other (e.g. aesthetic or social decisions) are more open, even though I questioned this proposition. In “Consumption” I short-circuited the different decision making layers, creating a direct causal link between prior consumer decisions and latter decisions about what urban sites to photograph.
The second point of view talks about “Consumption” as a way of recording time. The work is based on a diary format, where consumption is recorded and then re-lived in the form of a photographic project in the urban space of Taipei. Attention is directed to the data ecology, where consumer decision records are used by corporations, social scientists as well as national governments to further specific interests of one party. “Consumption” short-circuits these data flows by feeding personal data directly back into the personal decision-making process.
The third point of view describes the role reading in the project. Reading is understood as a universal activity of perceiving and understanding sensory input, which includes a process of pattern seeking and defining of what one sees. The surface of a building (the façade) is compared to the surface of a paper slip (the invoice), a visual similarity which has shaped the presentation format of “Consumption”. The process of short-circuiting decision making processes and data flows results in a re-composition of reading modes, opening up a new interpretative space.
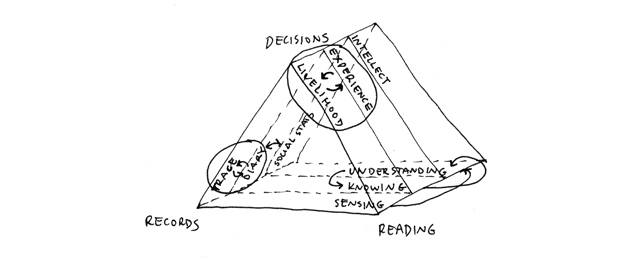
Fig. 11
“Consumption” has been conceived and executed during a three-month stay in Taipei, and it connects prior research interests of the author which have been present in other artworks, e.g. decision making (forked1), conceptual/physical space relations (corporation), and understanding of urban space (signifier series, secondness series and viewpoint series). On its own terms, it is however only a starting point of a larger endeavor investigating the relationship between consumer decisions, data flows and visual representation in the context of urban exploration.