c8400.com
consumption, hong kong (vol.1)
concept
‘Consumption: Hong Kong (Vol.1)’ is a research-based project, which traces the relationship between private sphere of individual decision making (e.g. what to buy for dinner) and the public sphere of aggregated socioeconomic effects which we get to know from the news (company revenue, stock price, GDP, unemployment, etc.) in the specific circumstances of Hong Kong. The work consists of an artist book, a multiple-channel video and supplementary materials. All elements come together in an installation setting.Economists like to use term ‘dollar voting’ to explain an analogy between consumer decisions and political decisions: In the same way citizens select between a number of political candidates, consumers use their dollars to select products and companies which will be the ‘losers’ and ‘winners’ of the market race. Theoretically, this example is used to highlight the ultimate power of consumers over producers.
‘Consumption: Hong Kong (Vol.1)’ traces the author’s consumer decisions during 12 months of his stay in Hong Kong (September 2013 – August 2014) and relates them to news items. It thus documents a personal narrative of a visitor, which can however be related to a more general experience of living in Hong Kong: For example the market concentration means that most people buy groceries in one of the two major supermarket chains as the author does. Also the average monthly expenditure level documented in ‘Consumption: Hong Kong (Vol.1)’ is similar to that of the majority of Hong Kong households.
The project does not work with detailed assumptions but uses a ‘decision recycling’ process, where previous independent consumer decisions (decisions made during a period preceding the project itself) are used to determine the selection of the news item of each day within the monitored period, allowing for a flexible interpretation by the reader.
Data Set
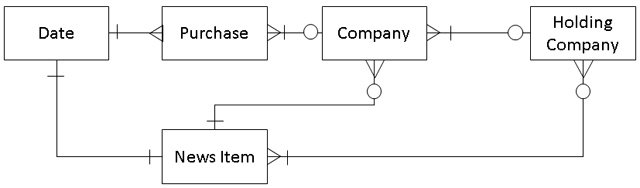
Each purchase (also known as ‘consumer decision’) is associated with a retail company where the purchase was made. These companies are grouped according to company holdings (10 company holding categories and 4 generic categories for unattributed consumption). News items published on the same day when the purchase was made are selected by searching for keywords like company name, holding company name, company owner name or, when no news item can be found, more generic terms like “Hong Kong economy”. The resulting data set has the following structure:
The Book
The book presents the data set in a linear narrative form. It documents the consumer decisions and associated news items day by day, including the full text of the news item. The book is a thick paperback printed in black and white, 826 pages long. It contains a preface (explaining the context) and introduction (explaining the method), followed by the body of the book, which lists the author’s daily consumption in Hong Kong and one daily news item. The book is a physical manifestation of the slow process/experience of reading and connecting disparate pieces of information relating to Hong Kong, its corporations and the world economy.
The Video
The video is a condensed visual counterpart to the book. It is based on the same data set, displayed in the form of a virtual 3D data sculpture consisting of a spatial arrangement of white spheres and news headlines in an infinite black space. Each sphere represents the spending on one day in one specific company group, the diameter of the sphere represents the amount spent. The spheres are ordered horizontally according to spending type and company group (14 categories) and vertically according to time. Each vertical layer represents one day and is associated with one news item headline (the associated news articles can be found in the book). The fast-paced video makes is barely possible to read the news headlines. The soundtrack of the video mirrors the visual pace: It consists of a voices reading out the news headlines, overlapping one another so that only fragments of the voice can be understood. Different channels of the video show different points of view of the data sculpture.
Supplements
The data set used for producing the book and the video-animation is used to generate further outputs according to location specific presentation and installation needs. For example, a projection of a scrolling full-text of the book has been used as an installation supplement and a series of photographs on which the consumption book is juxtaposed with the company headquarters in Hong Kong has been produced.